Start with the question — not the chart.
QA teams shouldn't have to build dashboards just to answer a simple question. Observatory flips it — pick what you want to know, and it builds the chart, drops it on a dashboard, and scores the whole project's health.
The answer's already built
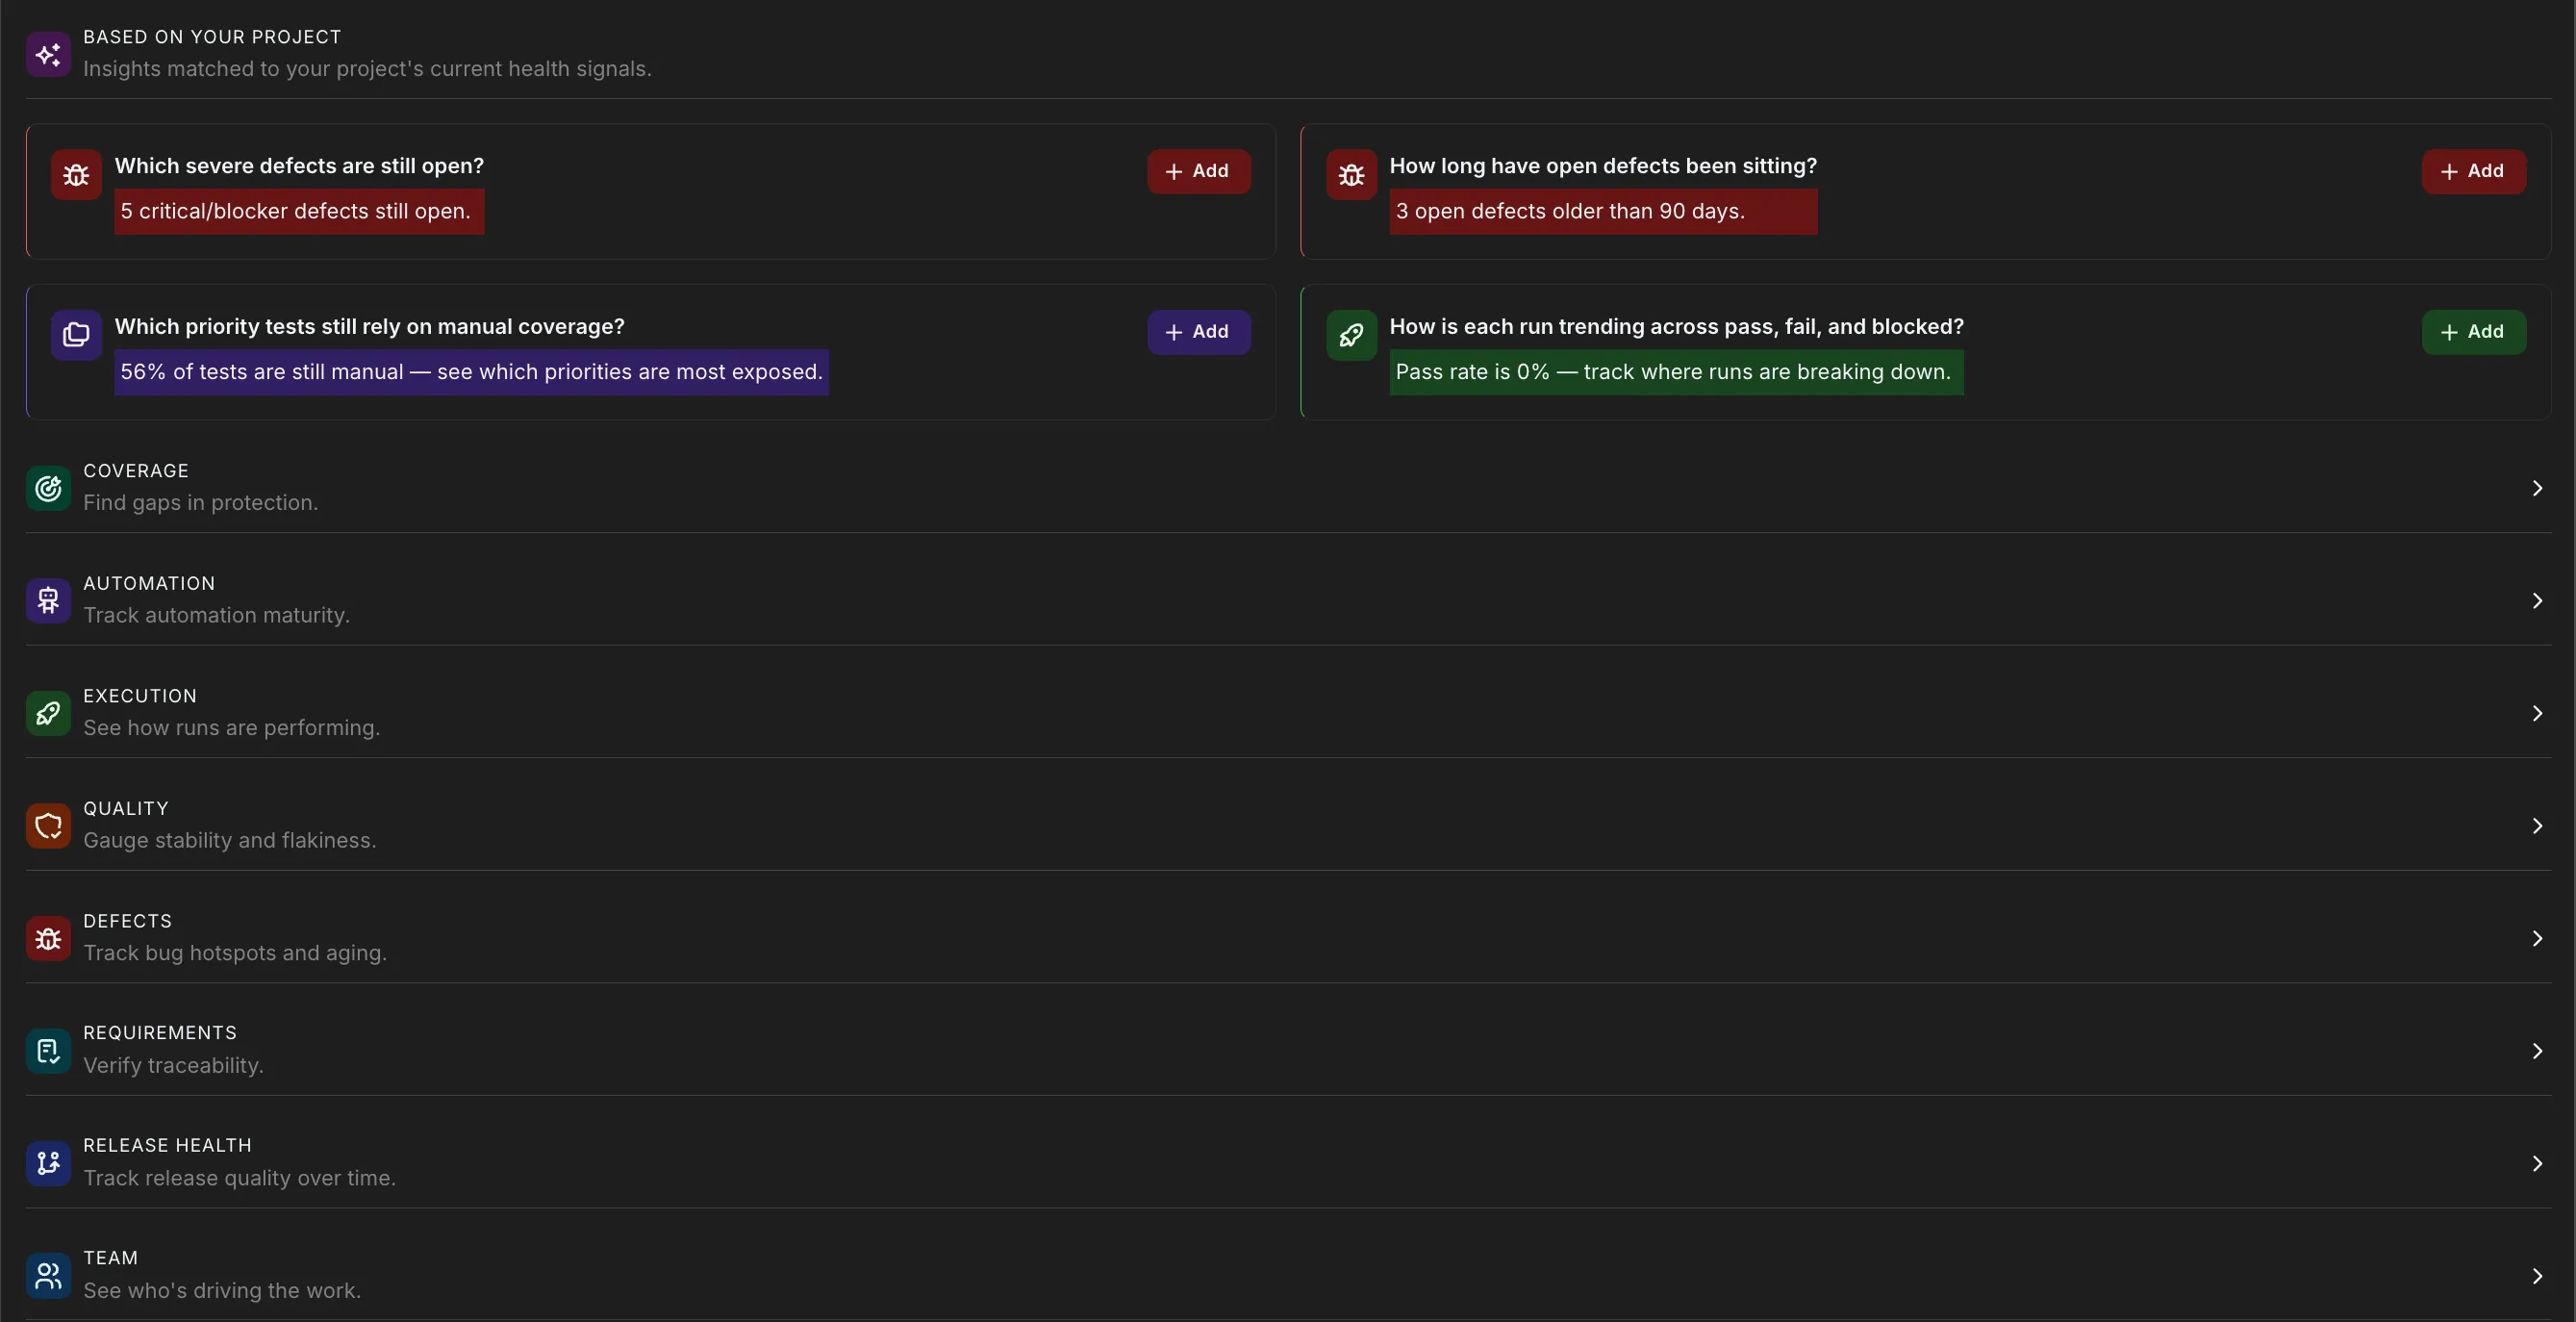
Pick what you want to know — coverage, automation, defect pressure — and the answer lands on your dashboard in one click. No queries, no chart config. 26 ready-made insights, each already wired to the right data.
A whole dashboard in one click
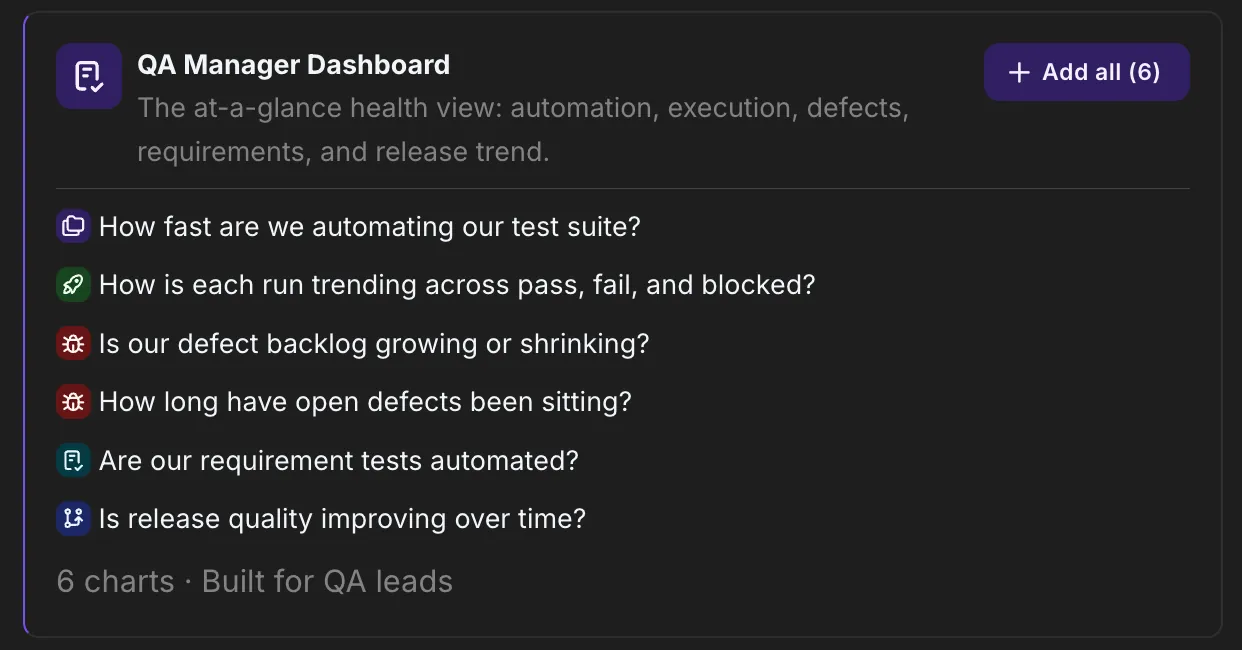
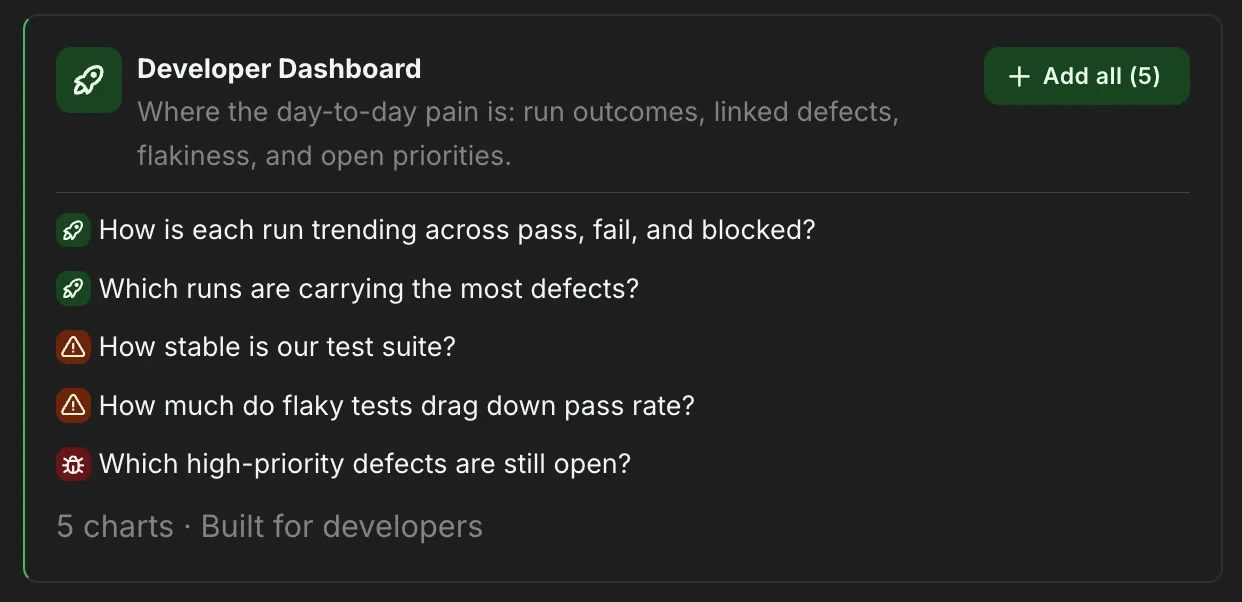
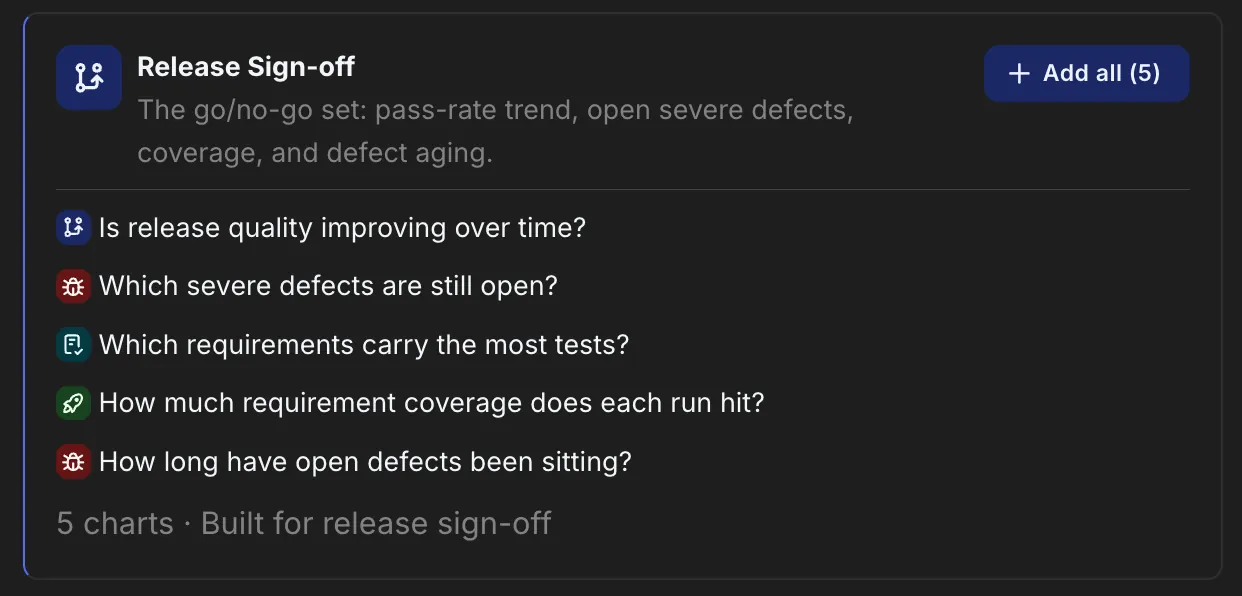
Most tools make you build a dashboard widget by widget. Observatory ships complete, role-ready dashboards — for QA managers, developers, and release sign-off — that drop in with a single click.
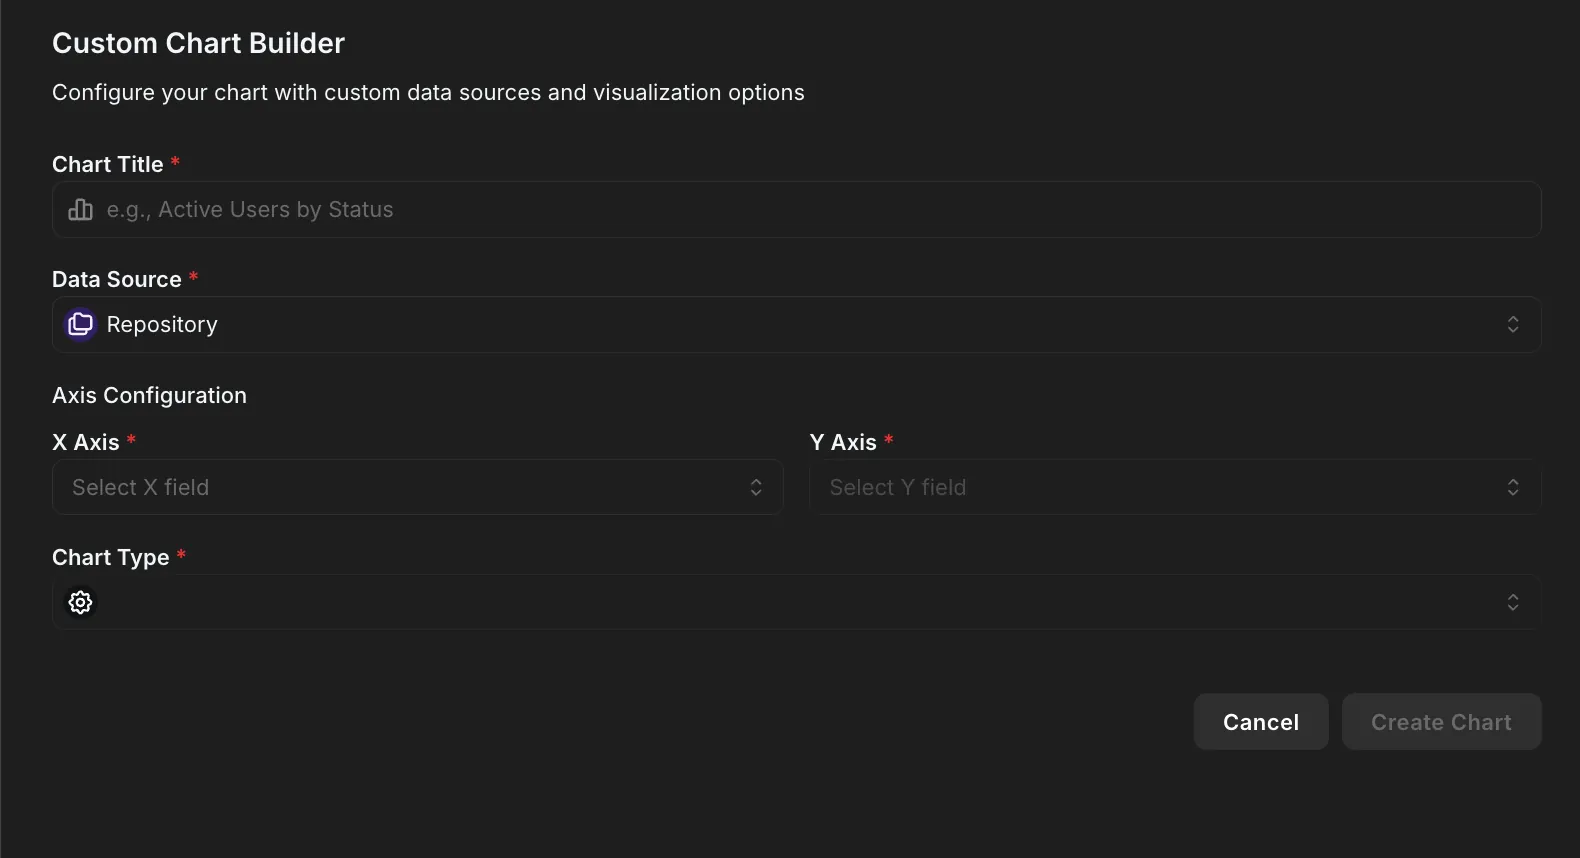
If you can ask it, you can chart it.
When a ready-made insight isn't the exact cut, open the chart editor. Every data source, every field, every relationship — build the exact chart you need and pin it to a dashboard, live in seconds.
Instead of opening six dashboards, Observatory already told you:
- Coverage dropped 8%
- Two critical defects still open
- Automation below target
- Release Health: 62 — Needs Attention
The meeting starts with a decision — not a dashboard.
One score for where you stand
Every release comes down to one question — can we ship? Observatory answers it with a single 0–100 score across five weighted signals. Same project, same score, every time.
And it tells you what to look at next
Observatory reads these same signals and surfaces the insights worth adding now — ranked by urgency, at most five at a time, each with a plain-English reason.
Which priority tests still rely on manual coverage?
Automation below 60%How is each run trending?
Pass rate below 80%Which severe defects are still open?
Open critical or blocker defectsPart of the bigger picture
Observatory is where you explore the data. When it's time to decide, Hawzu turns it into a scored release readiness verdict and downloadable QA reports.
See your quality, in one place
Every insight and dashboard is on every plan. Free for five people, $20 per member after — no credit card.